Social Network Analysis
Contributing to the work done here, to find improved ways of representing this social network's connectivity over three years; Doing social network analysis for the first time, I explored the networkx package to create a bunch of new figures
My Role: Independent analysis as a part of ICON laboratories
Status: Github
Research Group 1 Connections
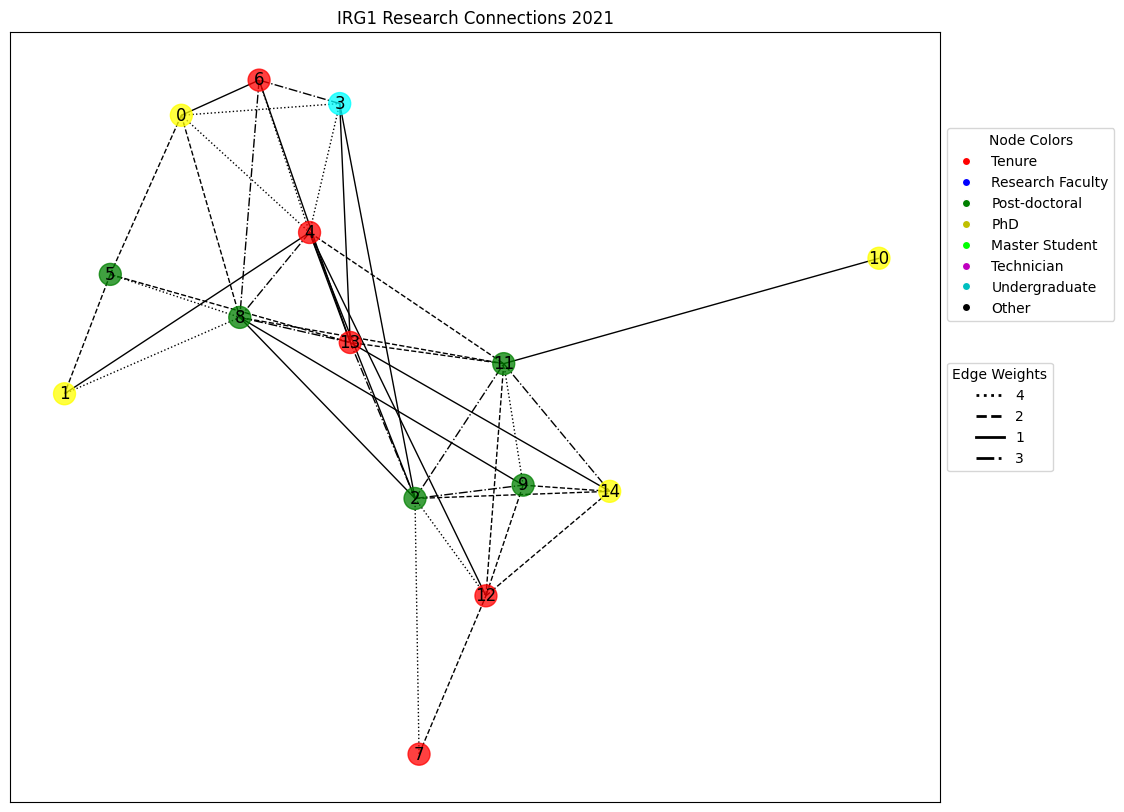
2021
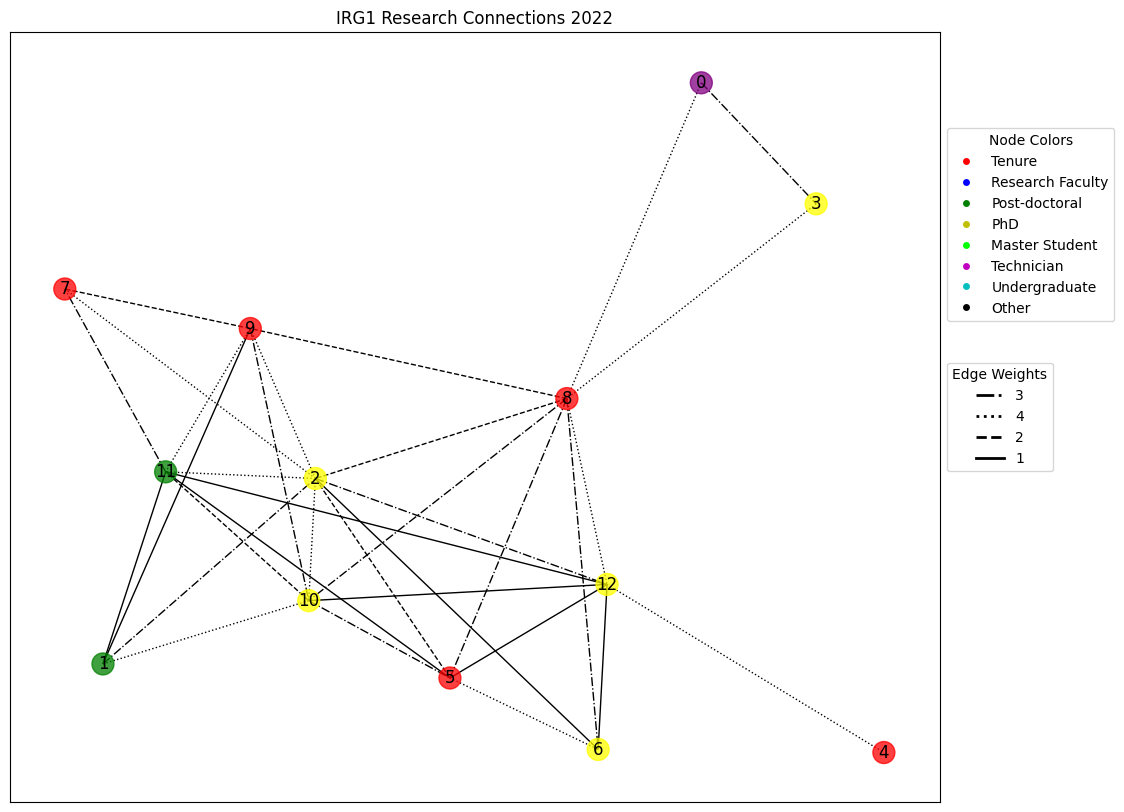
2022
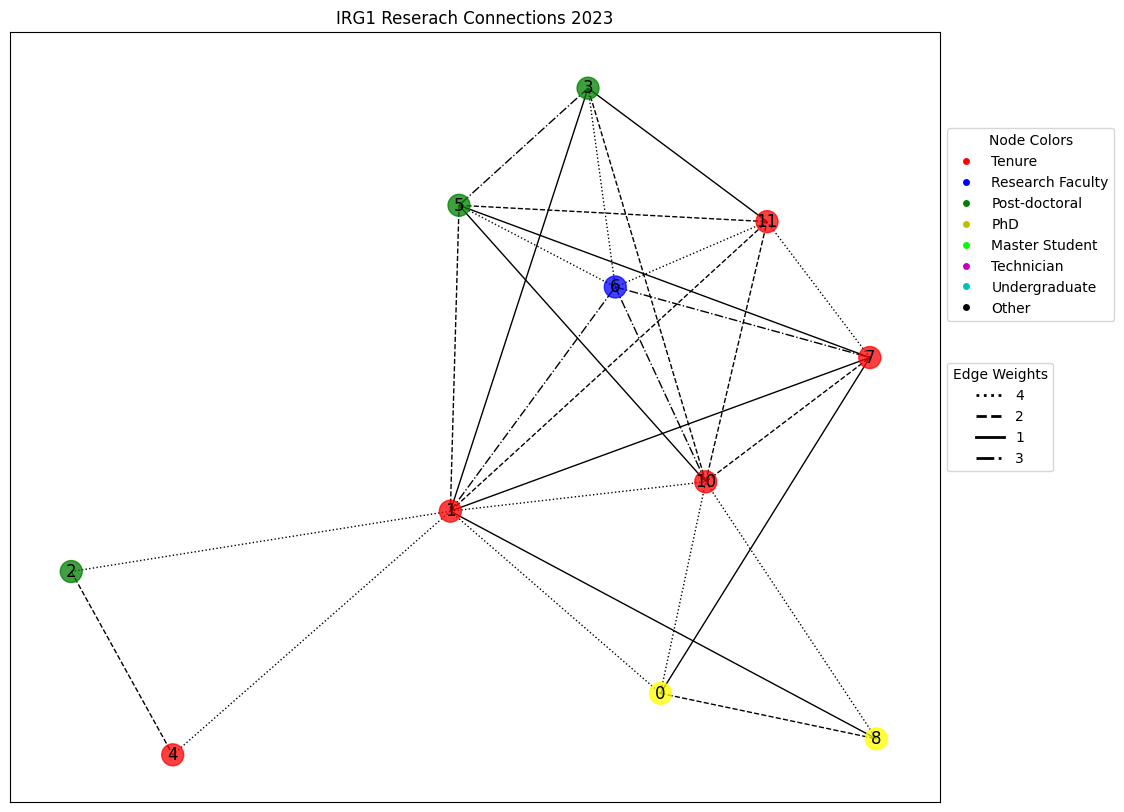
2023
Research Group 2 Connections
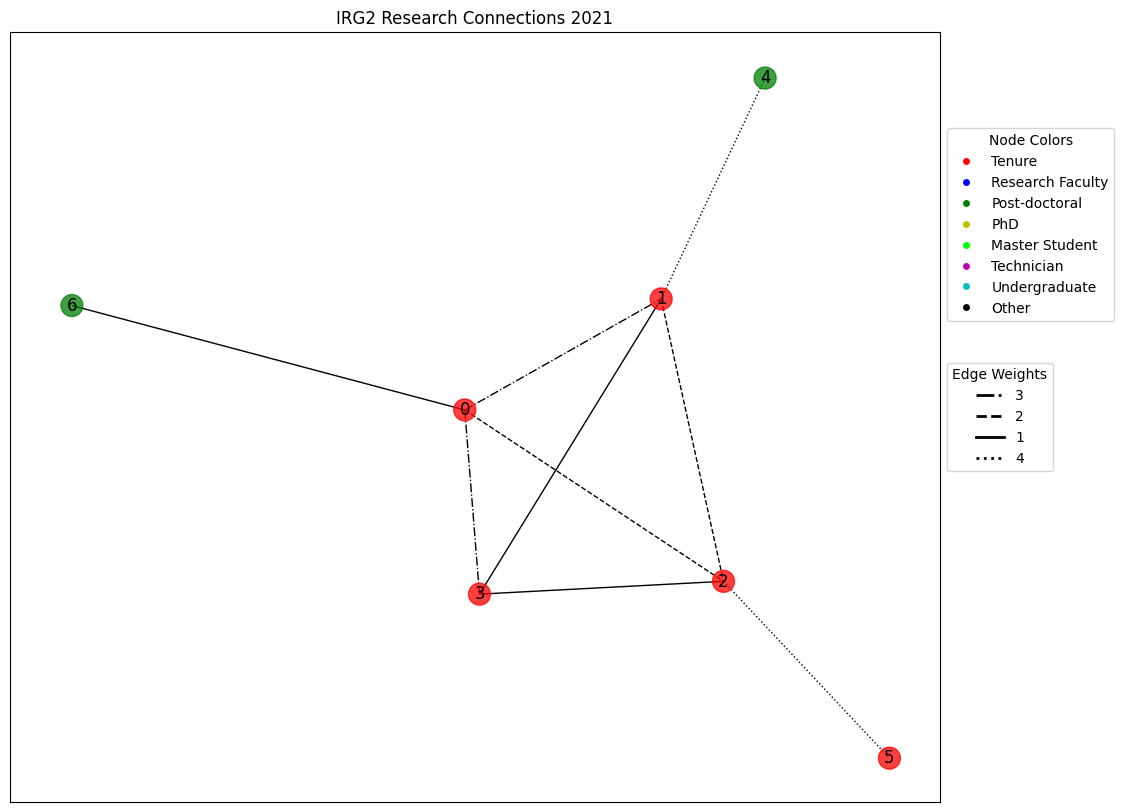
2021
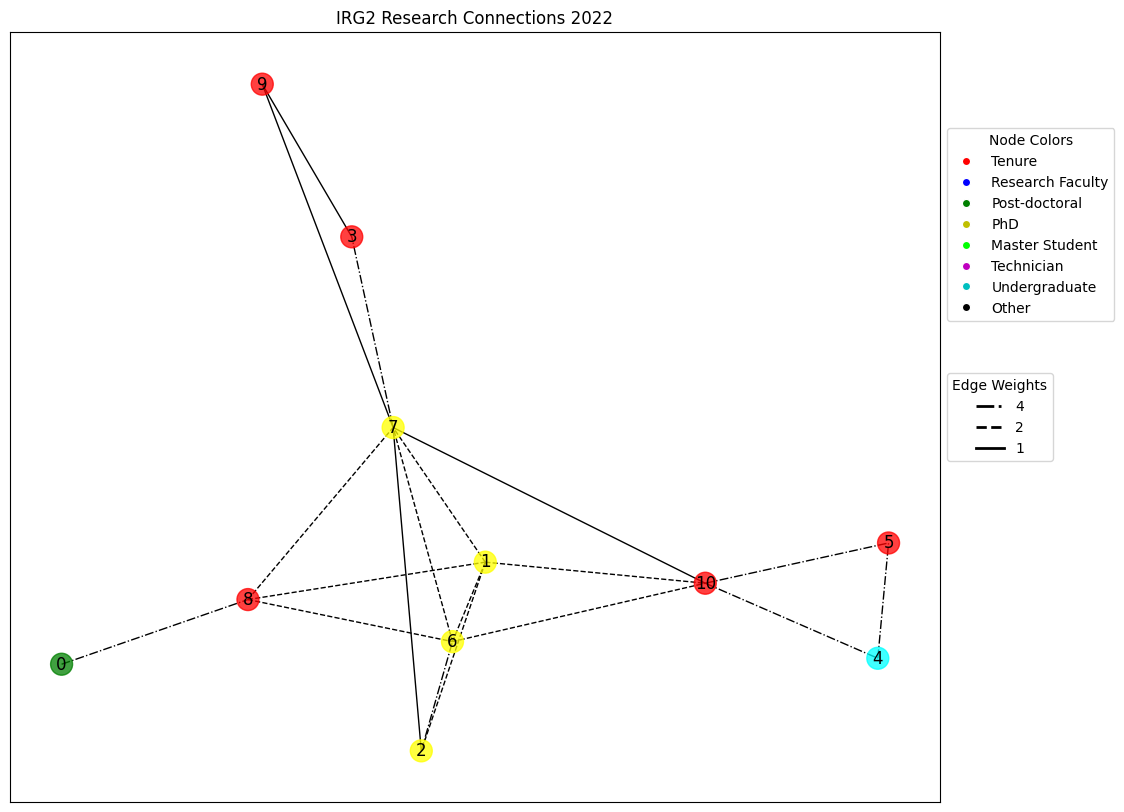
2022
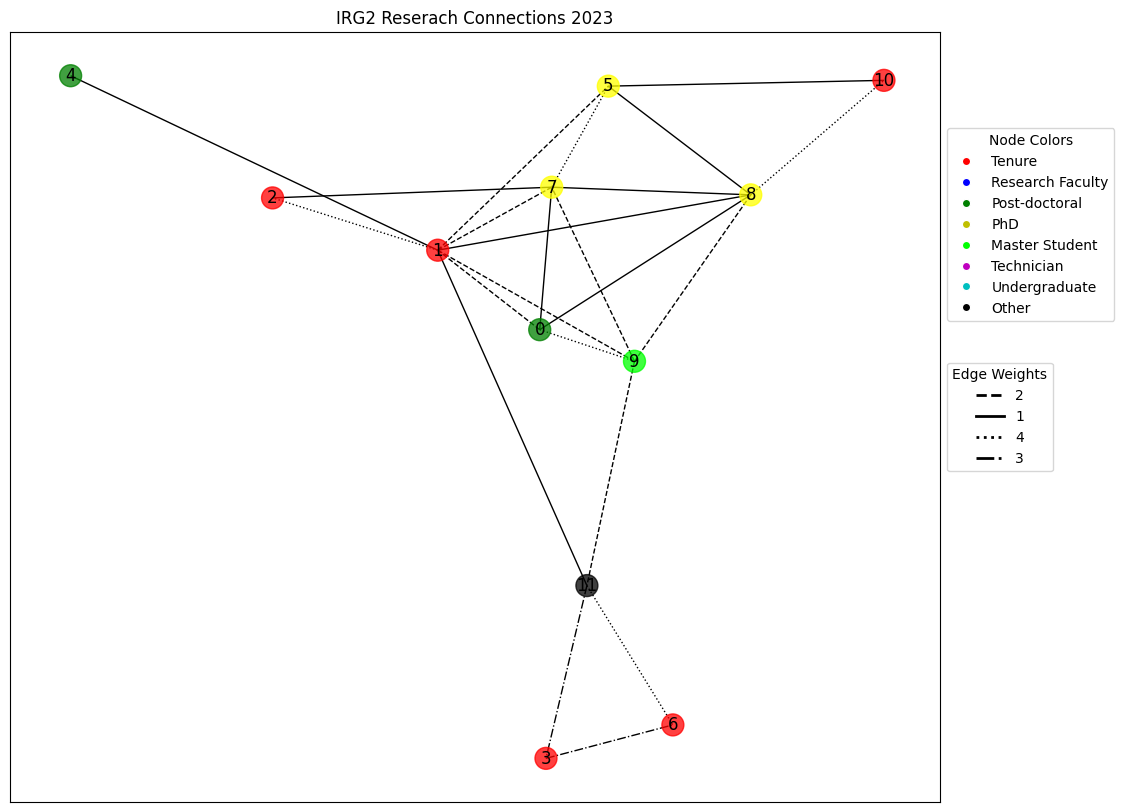
2023
Research Group 3 Connections
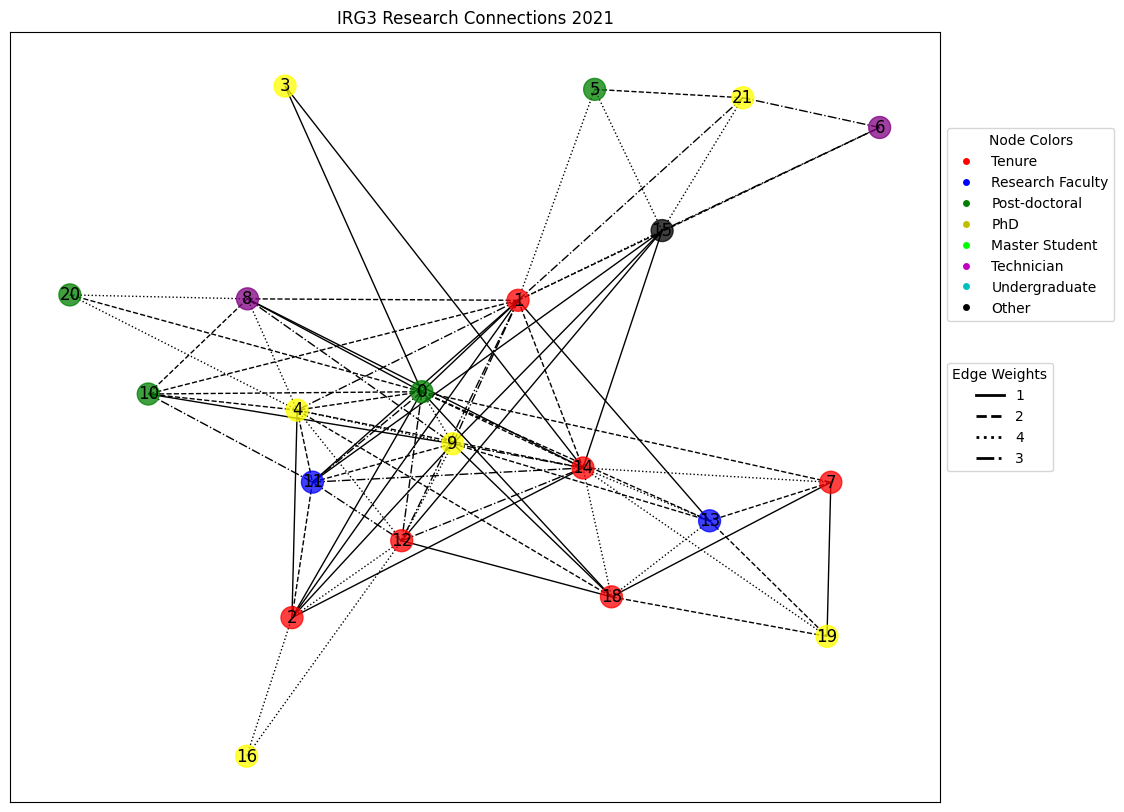
2021
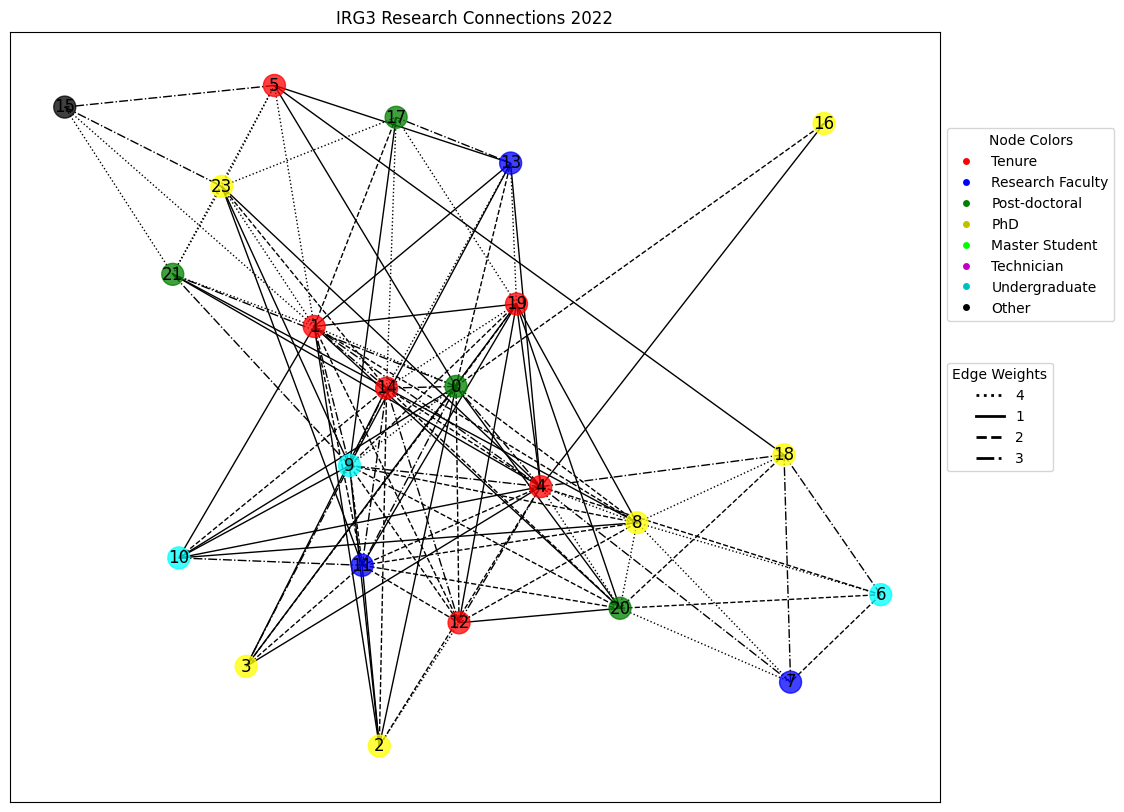
2022
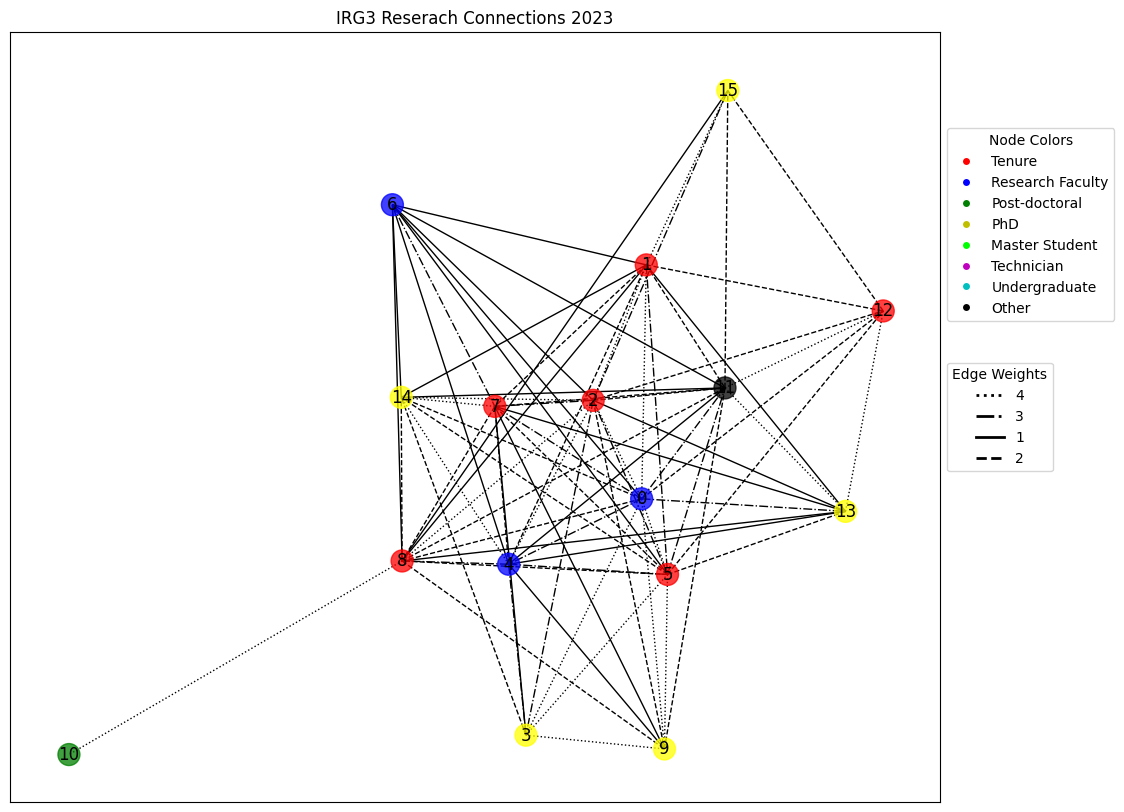
2023
Full Network Connections
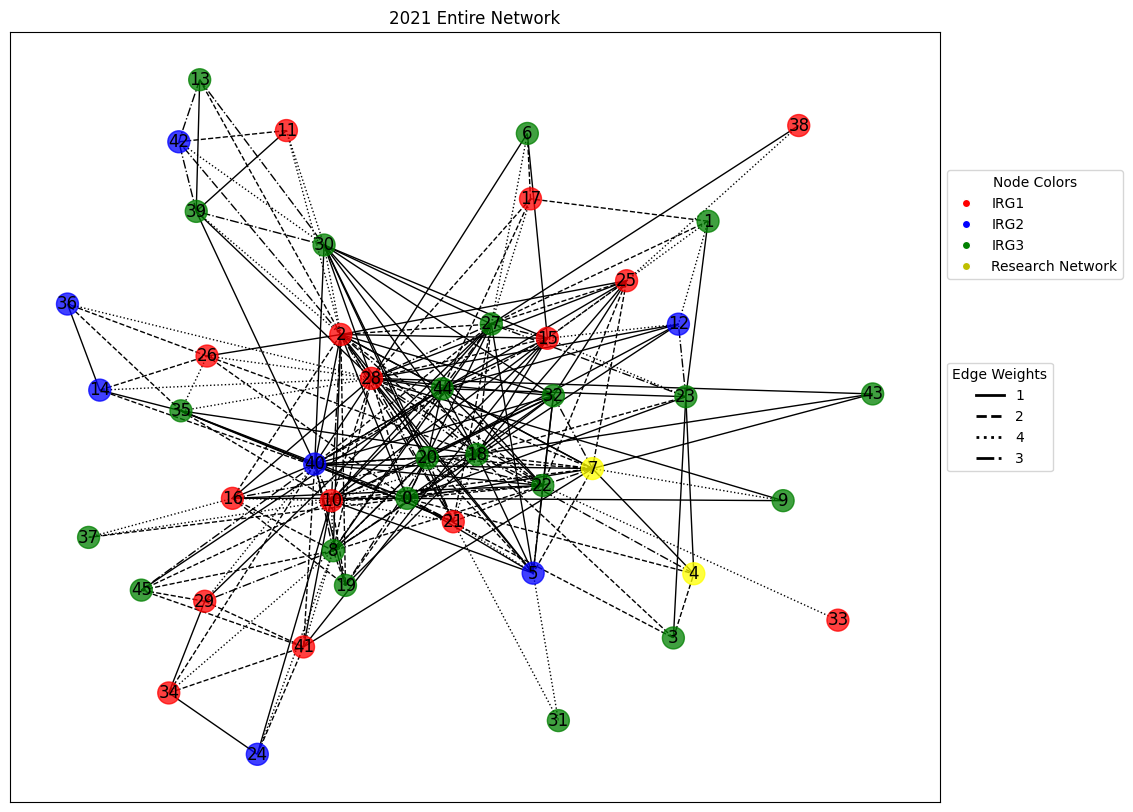
2021
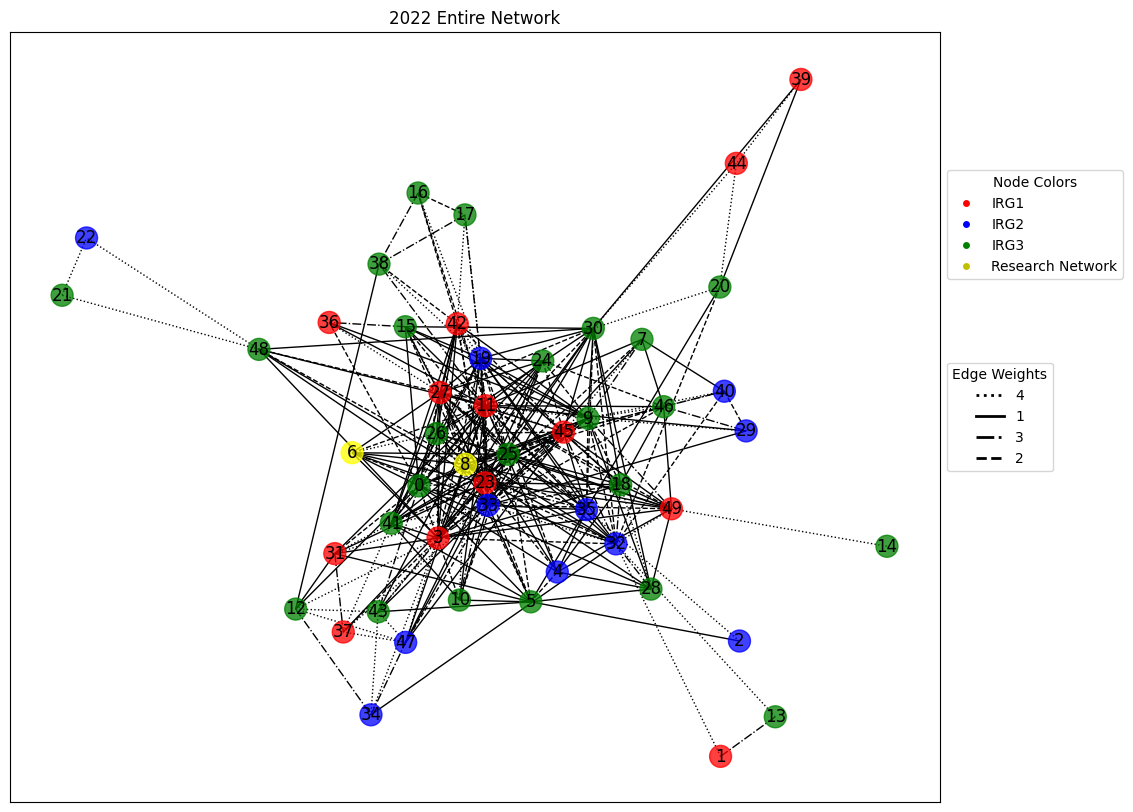
2022
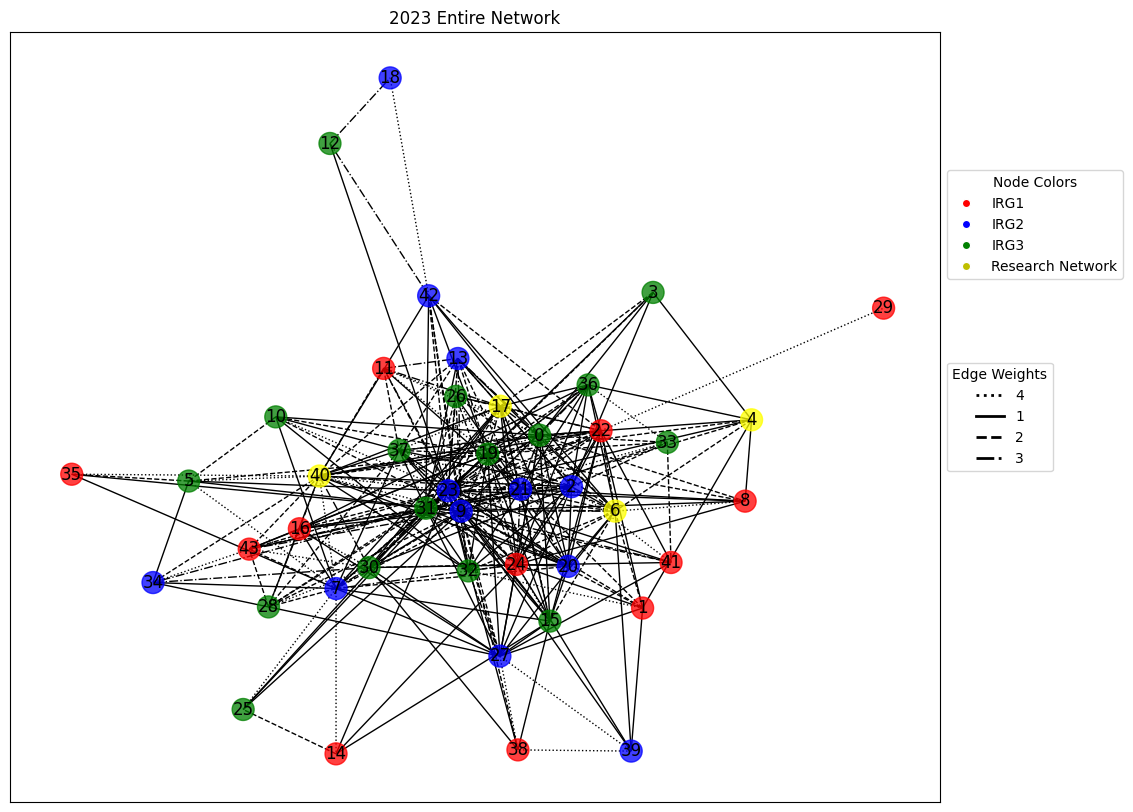
2023
I took advantage of this package by using it create a table of the average connectivity for each group and the entire network over the three years
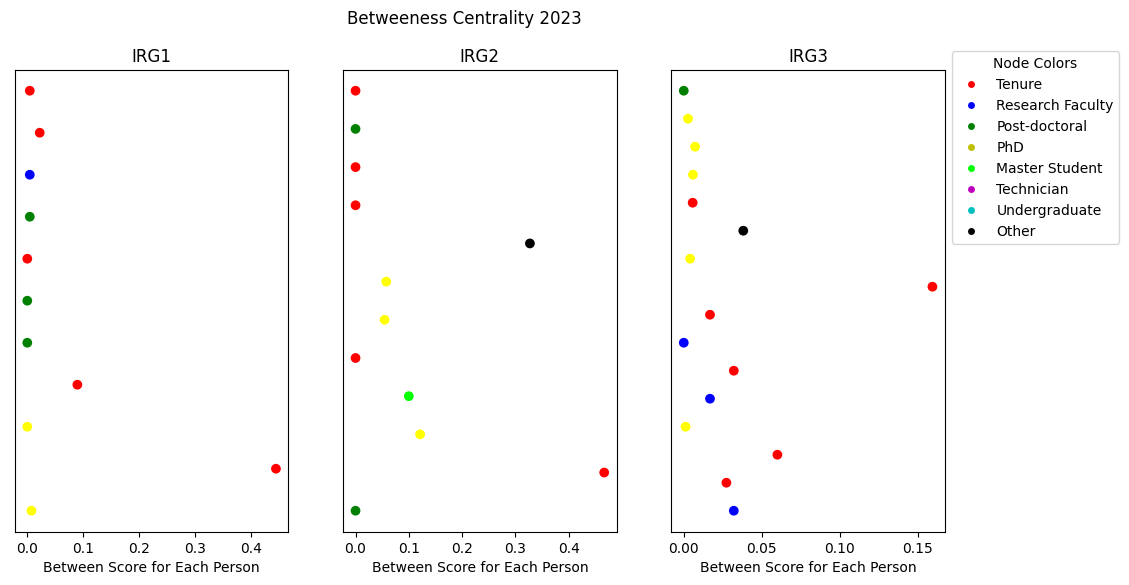
Likewise I made use of betweenness centralities and plotted these values for each group for each year
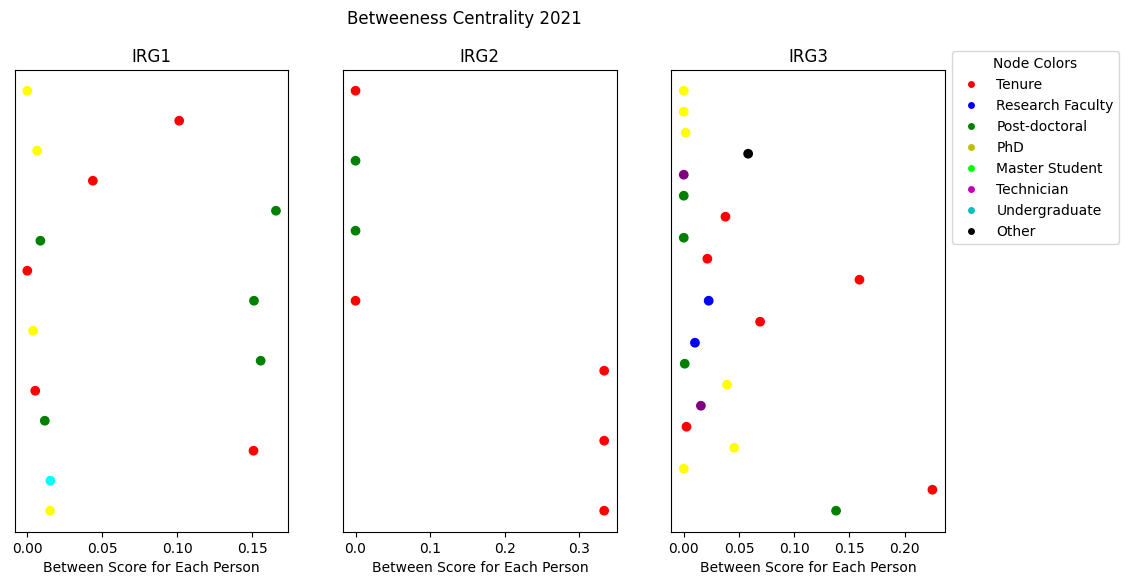
2021
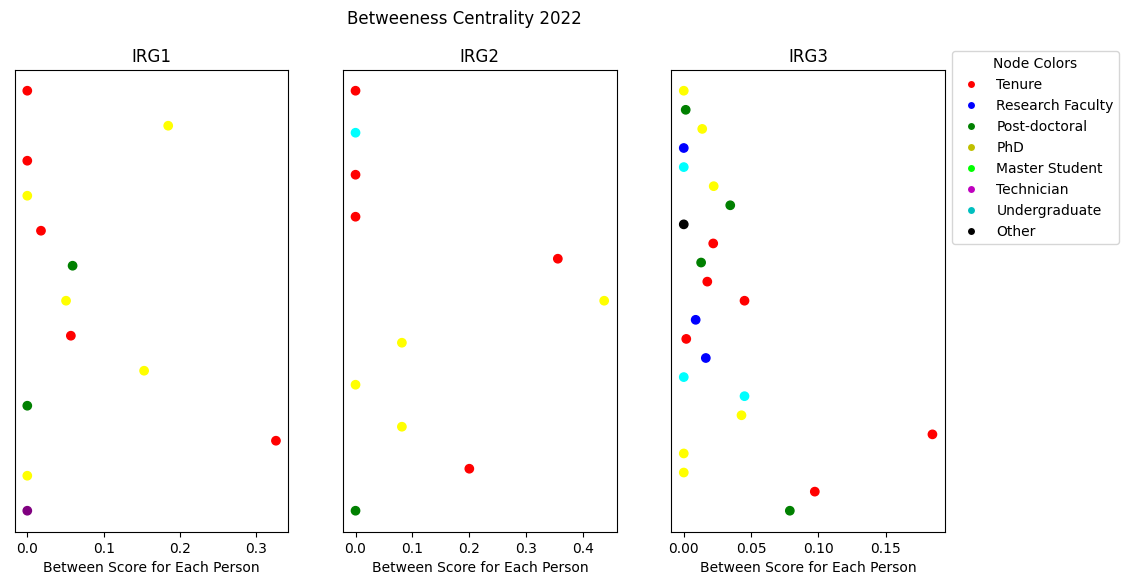
2022
